


With a surge in firearm sales, beginning when Covid lockdowns were first implemented, who has been buying all these guns?
We wanted to take a look at the hard data, so we turned to our own ATF Form 4473 Firearm Transaction records. This federal form is filled out on site by every firearm purchaser buying from a FFL (gun dealer like us).
Responses we compared:
To record demographics on the form 4473 it breaks down Ethnicity into Hispanic or Non-Hispanic, and breaks down Race into 5 categories: American Indian or Alaska Native, Black or African American, Asian, Black or African American, Native Hawaiian or Other Pacific Islander, and White.

It also records place of birth, sex, and birth date.
*note: while Non-binary is an option for question #14, it is required to match what is listed on the buyer’s driver’s license or state ID, and we have not yet had anyone check that box therefore it is not listed in the data table below.

Time Frames we compared:
Our 4473’s are hand filled out paper forms stored privately and securely on site. Therefore to collect this data it took extensive hours of physically handling and recording 4473 responses. Because of this we chose to compare monthly February through April of each year 2019-2021. The first wave of increased sales began March 18th 2020 after the “stay-at-home” order was announced in Illinois.
Notable points:
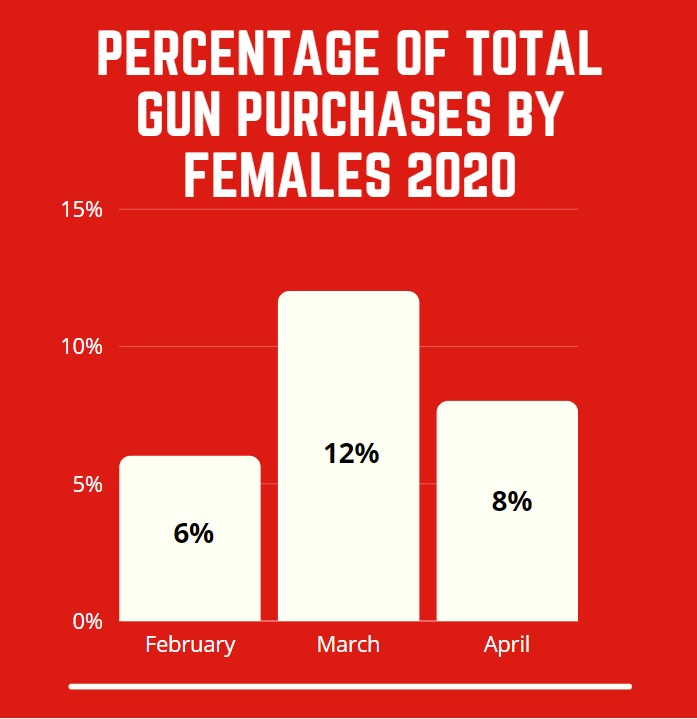
Purchases by females doubled in March of 2020 compared to previous month.
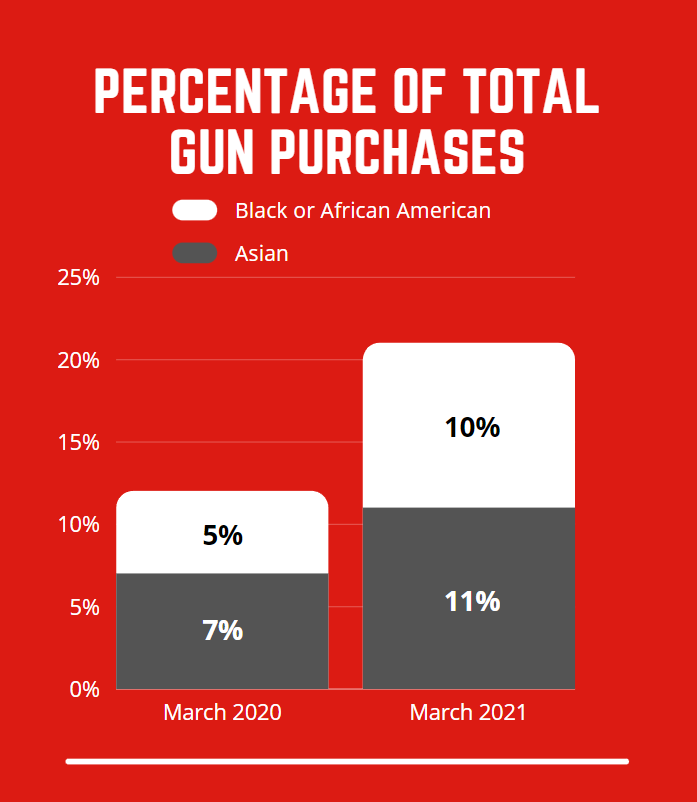
1.6x more purchases by Asian buyers in March 2021, and 2x more purchases by Black or African American buyers, compared to the same month previous year.
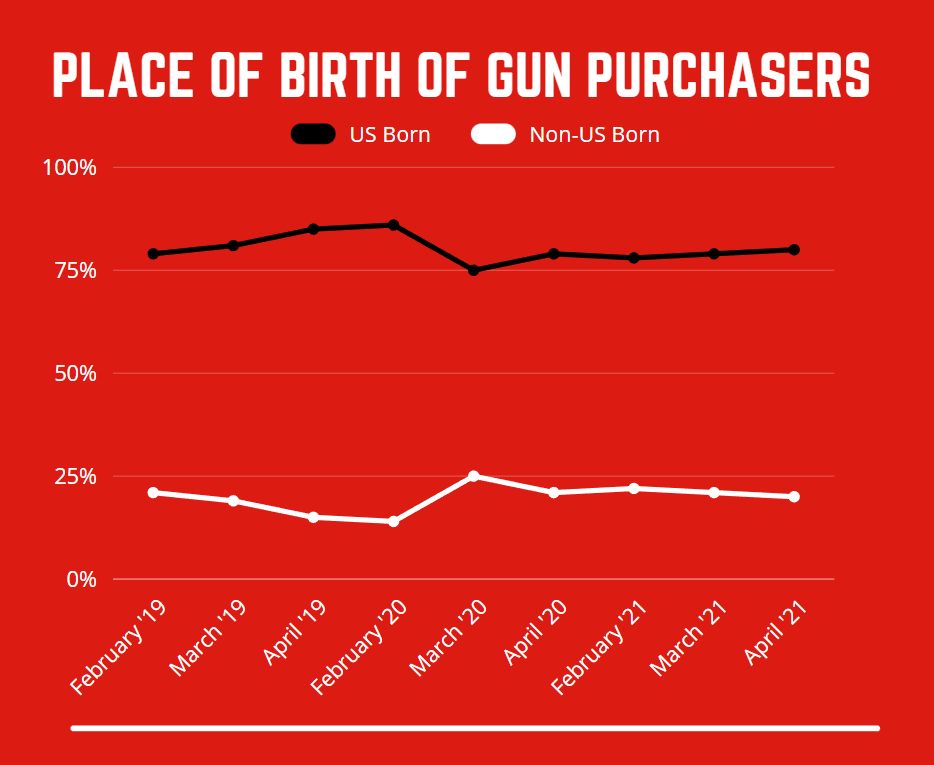
Purchases by Non-US born buyers increased in March of 2020, but then leveled back out.
The Aggregate Data:
Keep in mind the data below is just a small sample size from us, one gun store located outside of Chicago, and may not fully represent the city, state, or country as a whole. Another point to mention is sales may have more than doubled to begin with, but it probably would have been higher due to interest in purchasing increasing over 1,000% but the supply chain could not keep up with demand.